


Two identical offices. Fifty people each. Same computers, same lighting. One in Helsinki, one in Berlin.
Last updated November 5, 2026 · 6 min read · Data: Eurostat H1 2026

At a glance
- Cheapest offices: Finlandia (€0.093/kWh), Iceland, Norway — nuclear, hydro, geothermal.
- Most expensive: Irlandia (€0.267), Cypr, Italy — gas-dependent islands and peninsulas.
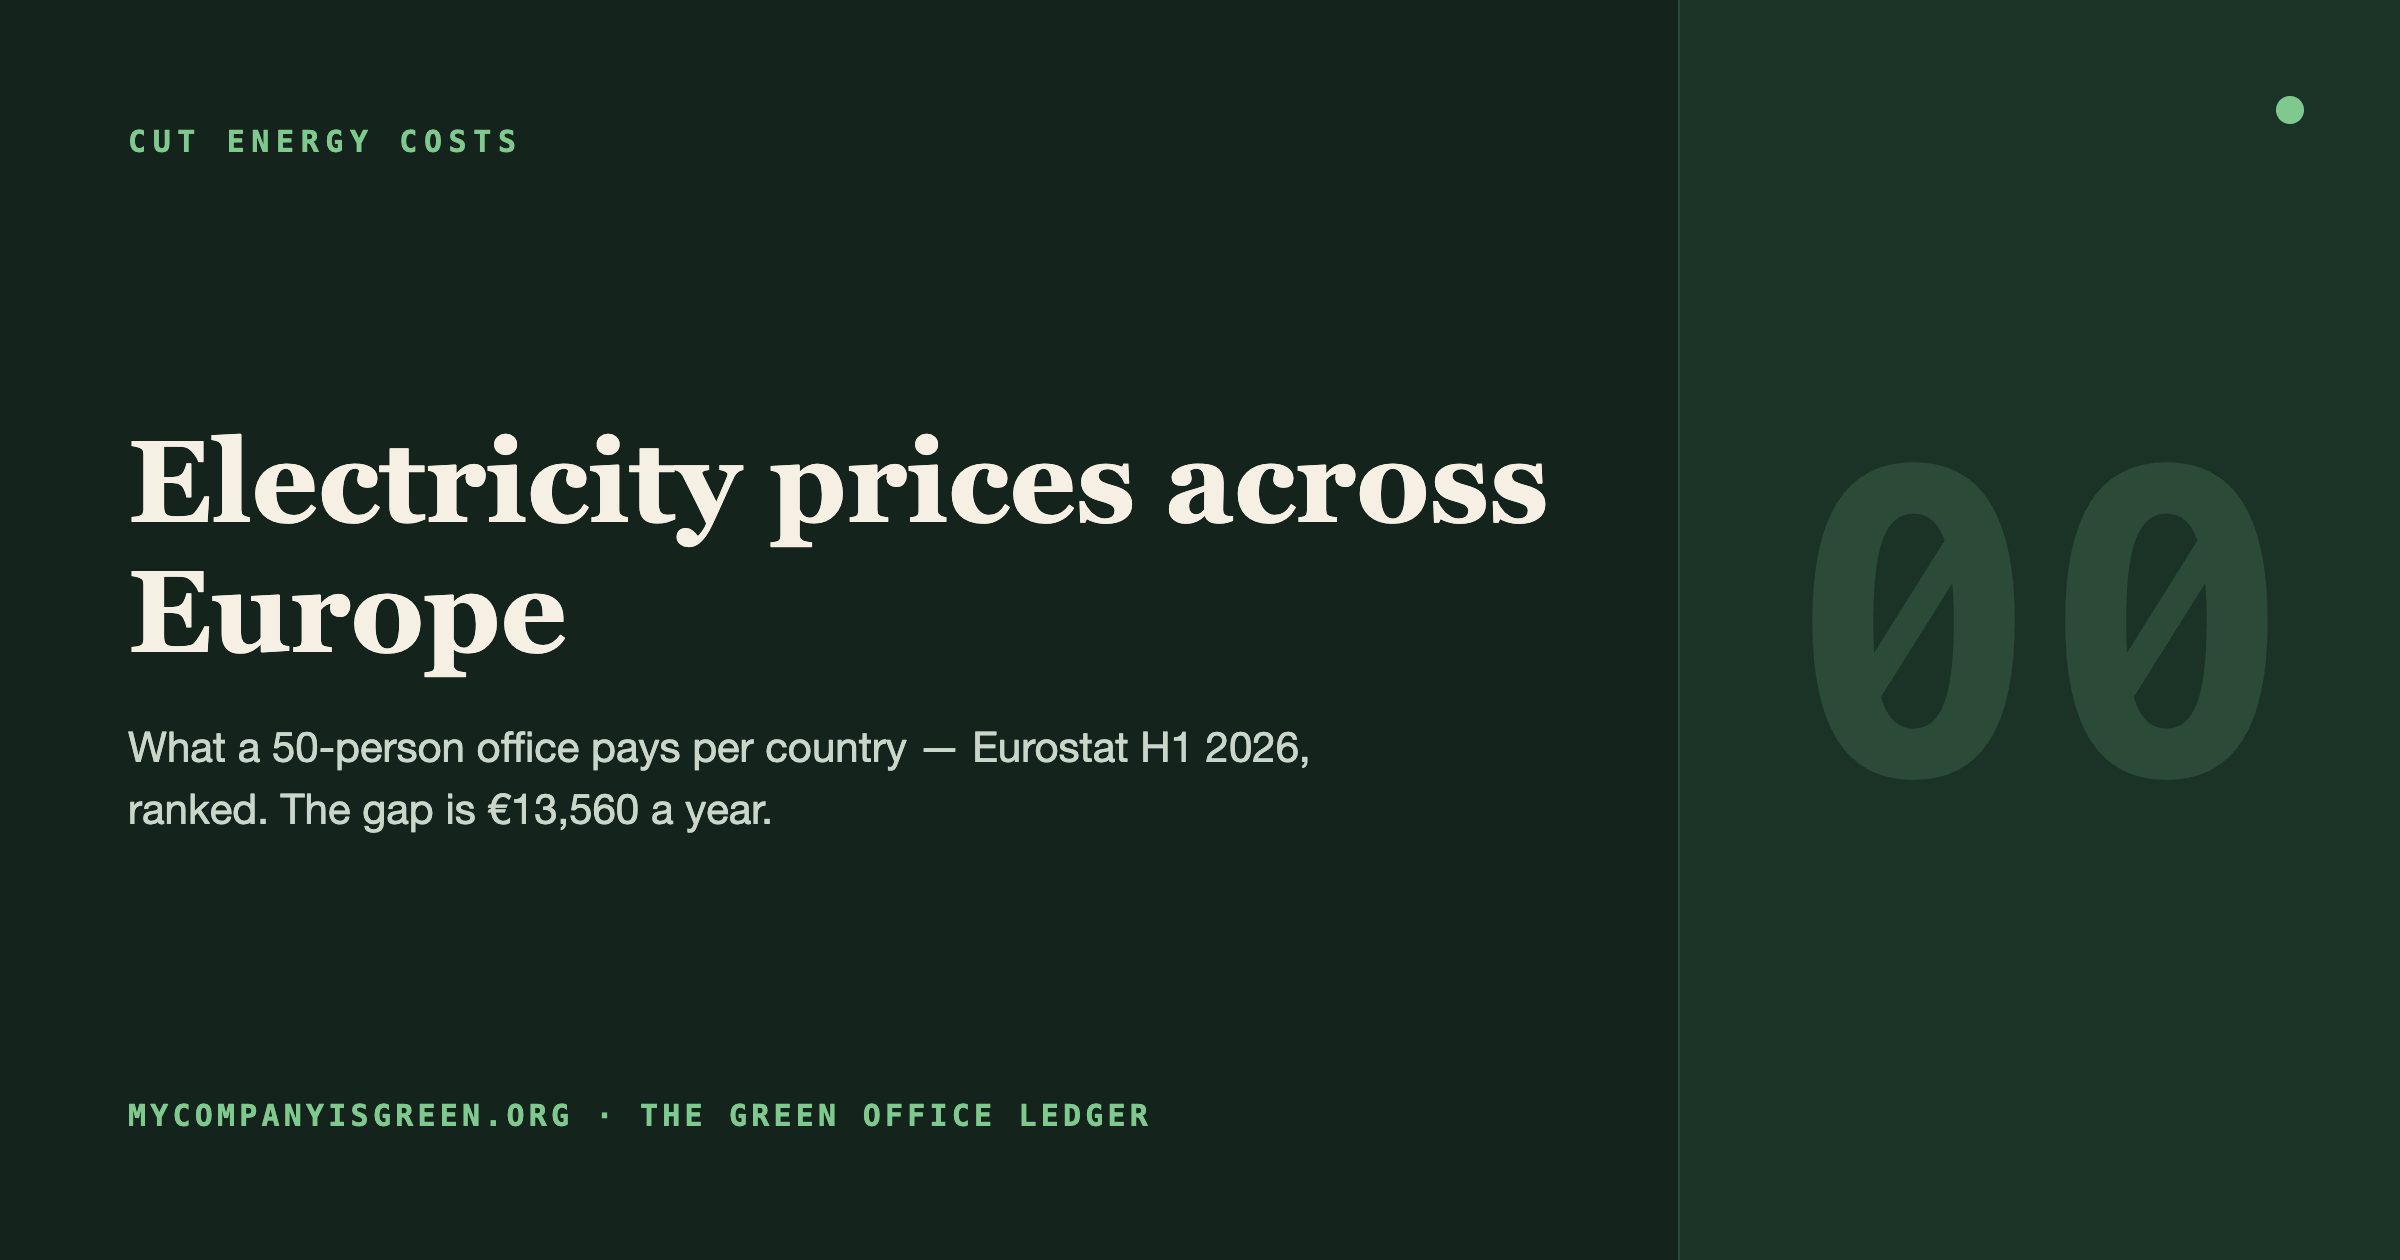
- A 50-person office pays up to €13,560/year more in Berlin than in Helsinki for the same electricity.
- Three actions with numbers: renegotiate at contract end (−20–30%), match tariff to load profile (−5–10%), LED retrofit (−5–15% of total bill).
Co zachowujesz
Switching a Berlin office to a Finnish-linked tariff≈ €13,560 / rok
Effort required~1 week of broker calls, brak wydatków inwestycyjnych
ZemstaFirst invoice
Take the Eurostat business data for January–June 2026 and run the numbers:
- Helsinki office: 120 MWh × €0.0928 = €11,136 per year
- Berlin office: 120 MWh × €0.2058 = €24,696 per year
The Berlin office pays €13,560 more for the same electricity: €271 per employee per year. Move the office to Dublin and the bill hits €31,992.
The gap is structural: Podatki, grid design and generation mix. Here is the full ranking.
The ranking: business and household prices, Styczeń–czerwiec 2026
Business prices are for a consumer using 500–2,000 MWh per year, excluding VAT and recoverable taxes (the level most SMEs actually pay). Household prices include all taxes and VAT. Źródło: Eurostat nrg_pc_204 and nrg_pc_205, retrieved 5 Listopad 2026.
| Rank | Kraj | Business €/kWh | Household €/kWh | Context |
|---|---|---|---|---|
| 1 | Finlandia | 0.0928 | 0.2694 | Nuclear and hydro: Europe’s cheapest |
| 2 | Iceland | 0.1137 | 0.2076 | Hydro and geothermal |
| 3 | Norway | 0.1166 | 0.1993 | Hydro surplus; households track spot prices |
| 4 | Szwecja | 0.1177 | 0.3062 | Nuclear and hydro; taxes push households high |
| 5 | Portugalia | 0.1273 | 0.2367 | High wind and solar share |
| 6 | Denmark | 0.1303 | 0.2375 | Cheap wind; taxes take 49% of household bills |
| 7 | Hiszpania | 0.1336 | 0.2509 | Iberian market, renewables |
| 8 | Luxembourg | 0.1353 | 0.2023 | Negative net tax share |
| 9 | Malta | 0.1358 | 0.1268 | Household prices state-capped |
| 10 | Latvia | 0.1367 | 0.2415 | Hydro-heavy |
| 11 | Estonia | 0.1399 | 0.2118 | Oil shale share falling |
| 12 | Bulgaria | 0.1452 | 0.1341 | Regulated prices, nuclear base load |
| 13 | Slovenia | 0.1463 | 0.2118 | Nuclear plus hydro; fell 16.6% rok po roku |
| 14 | Francja | 0.1567 | 0.2485 | Nuclear fleet: 13% below EU average |
| 15 | Croatia | 0.1610 | 0.1816 | Hydro, regulated tariffs |
| 16 | Czechia | 0.1671 | 0.2884 | Coal and nuclear, high levies |
| 17 | Greece | 0.1702 | 0.2401 | Gas-to-renewables transition |
| 18 | Liechtenstein | 0.1752 | 0.2988 | Import-dependent |
| 19 | Lithuania | 0.1760 | 0.2162 | Grid reconfiguration |
| 20 | Romania | 0.1854 | 0.2836 | Caps ended July 2025; prices jumped 15.4% |
| 21 | Belgium | 0.1902 | 0.3575 | Nuclear shutdowns plus high household levies |
| 22 | Austria | 0.1918 | 0.3260 | Household prices rose 34.3% rok po roku |
| 23 | Slovakia | 0.1937 | 0.1985 | Nuclear-heavy, high network costs |
| 24 | Holandia | 0.2027 | 0.2440 | Negative net tax share, yet above the EU average |
| 25 | Niemcy | 0.2058 | 0.3618 | High levies and grid fees; eased in 2026 |
| 26 | Polska | 0.2070 | 0.2999 | Coal; household caps ended 2026 |
| 27 | Hungary | 0.2183 | 0.1139 | Cheapest households via caps; businesses pay more |
| 28 | Włochy | 0.2253 | 0.3142 | Import-dependent gas fleet |
| 29 | Cypr | 0.2306 | 0.2688 | Island grid, imported fuels |
| 30 | Irlandia | 0.2666 | 0.3871 | Gas-dependent island, constrained grid, worst in both bands |
| — | Średnia UE | 0.1800 | 0.2832 | Weighted by consumption |
Read both columns together. Hungary looks cheap until you spot the split: capped household rates at €0.1139, business rates 92% higher. Denmark’s wind is cheap for businesses, then taxes nearly double it for households. The countries punishing offices hardest, Irlandia, Cyprus and Italy, share one trait: islands or peninsulas dependent on imported gas, weakly connected to cheaper neighbours.
Dwa kraje brakujące w tabeli
Eurostat stopped collecting UK and Swiss price data, so they get their own line:
- United Kingdom: DESNZ puts small/medium businesses (500–1,999 MWh/year, same band) at 27.67p/kWh including the Climate Change Levy in Q2 2026: mniej więcej €0.33/kWh at the ECB rate of 5 Listopad 2026 (€1.1991/£), worse than Ireland. The smallest band pays 38.36p, about €0.46.
- Switzerland: regulator ElCom reports a median household tariff of 27.7 cents/kWh for 2026, O nas €0.30/kWh (ECB: €1.0893/CHF). Businesses off regulated tariffs land lower; hydro-rich cantons start near 22 cents.
Co zachowujesz: three actions with numbers attached
- Renegotiate at contract end. Businesses rolling off 2022–2023-vintage contracts save 20–30% in the UK renewal market, per comparison data covering thousands of renewals. Ciągnij 12 months of half-hourly consumption data first; quotes without it are guesses.
- Match the tariff to your load profile. A study of 7,500+ UK businesses (Energy Efficiency Science, Springer) found most SMEs benefiting from time-of-use or real-time tariffs save under 5%, z 10% a practical ceiling. If a salesperson promises 25% from load shifting alone, ask for their dataset. The 5–10% lives in shifting flexible loads: EV charging, pre-cooling, batch processes.
- Fix the lighting, then check the meter class. Lighting runs 15–20% of office electricity (US DOE). Measured LED retrofits cut it 27–29% (PNNL), do 75% with controls (LBNL): expect 5–15% off the total bill. Also check that contracted capacity matches actual peak demand; oversizing inflates fixed costs, and UK statistics show the smallest consumers pay a 45% per-kWh premium over the all-business average.
Metodologia
Business prices: Eurostat nrg_pc_205, band 500–2,000 MWh/year, tax level X_VAT (excludes VAT and recoverable taxes). Household prices: nrg_pc_204, band 2,500–5,000 kWh/year, tax level I_TAX (all taxes and VAT). Both cover January–June 2026, the latest published semester, in EUR as reported. Retrieved 5 Listopad 2026 via the Eurostat API. Cross-checked against the Eurostat news release of 8 May 2026 and the EnergyBoard H2 2025 ranking (27/27 countries match exactly), plus France’s SDES. UK and Swiss figures come from DESNZ and ElCom; neither country reports to Eurostat.
Źródła
- Eurostat, Statystyki cen energii elektrycznej (nrg_pc_204/205), 5 Listopad 2026: https://ec.europa.eu/eurostat/statistics-explained/index.php?tytuł=Electricity_price_statistics
- Komunikat prasowy Eurostatu, non-household prices H2 2025, 8 May 2026: https://ec.europa.eu/eurostat/web/products-eurostat-news/w/ddn-20260508-2
- Komunikat prasowy Eurostatu, household prices 2025, 5 May 2026: https://ec.europa.eu/eurostat/en/web/products-eurostat-news/w/ddn-20260505-1
- EnergyBoard, H2 2025 cross-check: https://energyboard.eu/en/business-electricity-prices/
- SDES (Francja), electricity prices 2025: https://www.statistiques.developpement-durable.gouv.fr/prix-de-lelectricite-en-france-et-dans-lunion-europeenne-en-2025
- DESNZ, UK business prices by size (QEP 3.4.2, 29 Wrześeń 2026): https://ukchargingsolutions.co.uk/data/business-electricity-prices
- ElCom/Swissgrid, Swiss tariffs 2026: https://swissgrid.ch/en/home/about-us/company/electricity-price.html
- Energy Efficiency Science 9 (2016), tariff-switching study: https://doi.org/10.1007/s12053-015-9404-9
- US DOE/FEMP, LED retrofit case study: https://www.energy.gov/cmei/femp/espc-enable-project-us-department-energy-headquarters-reduces-lighting-energy-use-50
- ECB reference rates, 5 Listopad 2026: https://api.frankfurter.dev/v1/latest?base=GBP&symbols=EUR
Następny przeciek do naprawy
Carla Lavigne jest redaktorką działu Green Ops w mycompanyisgreen.org i koleżanką, która przynosi kalkulator na audyt.
Więcej z księgi
Obciążenie widmo: ile kosztuje elektronika biurowa podczas snu
Monitory, Drukarki i ekspresy do kawy spalają moc całą noc. Zmierzone obciążenia czuwania, roczny koszt euro za biuro zatrudniające 50 osób, oraz smart-strip payback.
CSRD przy ograniczonym budżecie: Raportowanie zrównoważonego rozwoju dla firm, które nie są notowane na giełdzie
Co do cholery 2025 Omnibus faktycznie zmienił się dla MŚP, ile kosztuje pierwszy raport VSME dla firmy zatrudniającej 50 osób, oraz pięć źródeł danych, które już posiadasz.
Audyt odpadów biurowych: Weekendowy przewodnik, który sam się zwraca
Przeprowadź audyt odpadów w jeden weekend. Rzeczywiste taryfy poboru, co faktycznie znajduje się w pojemnikach biurowych, a ile renegocjacja zaoszczędzi — zazwyczaj 1 000–3 000 €...